The essence of ultrasonic testing: In-depth analysis of A-scan images.
views:2,156
author:admin
source:Hiwave
time:2025-01-02
catogory:Frequently Asked Questions
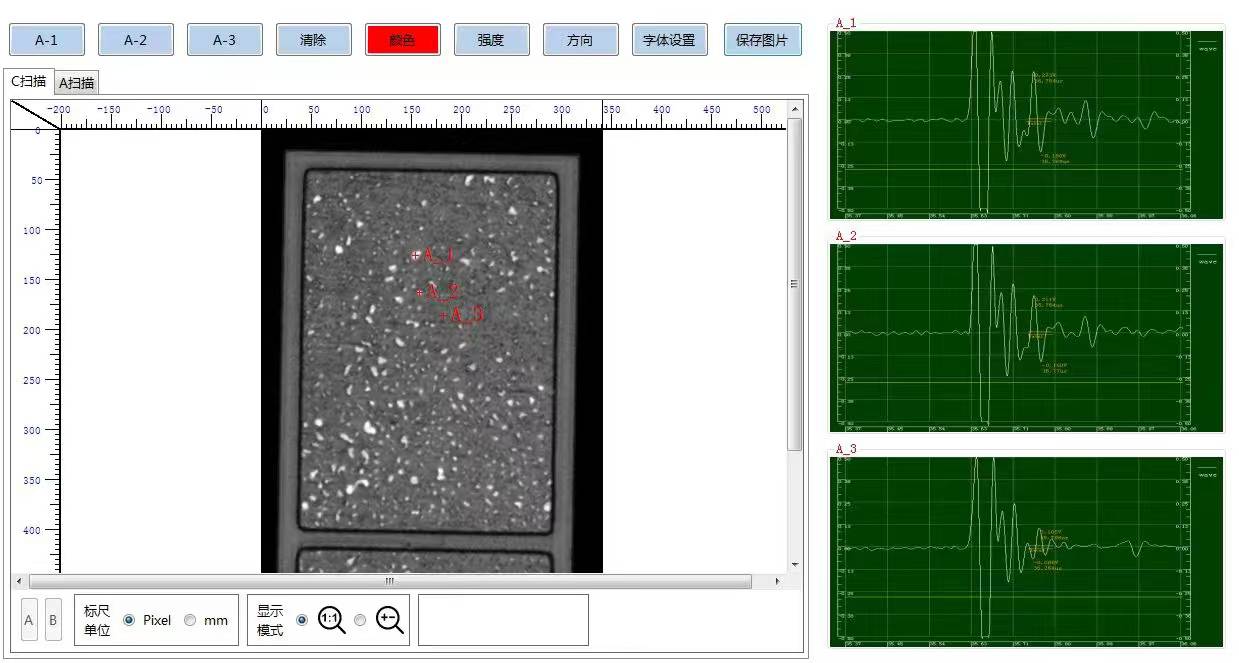
This image shows an A-scan image and the corresponding C-scan image from an Ultrasonic Scanning Acoustic Microscope (SAM). The following steps outline how to analyze……
This image shows an A-scan image and the corresponding C-scan image from an Ultrasonic Scanning Acoustic Microscope (SAM). The following steps outline how to analyze these images: