Scanning Modes of SAT
views:2,334
author:Hiwave
source:Hiwave
time:2025-09-05
catogory:Frequently Asked Questions
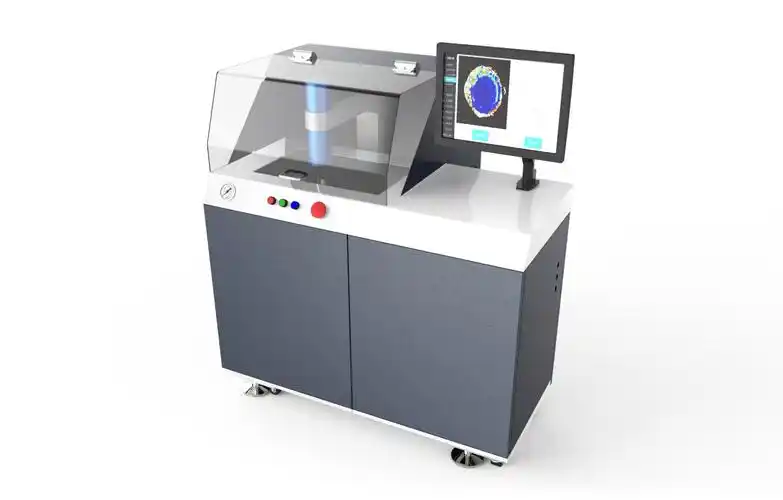
Scanning Acoustic Microscope (SAM) is a non-destructive testing equipment that uses high-frequency ultrasound to probe the internal structure of materials. It works ……
Scanning Acoustic Microscope (SAM) is a non-destructive testing equipment that uses high-frequency ultrasound to probe the internal structure of materials. It works by transmitting ultrasonic waves into a sample and receiving the acoustic signals reflected from different internal interfaces. Based on the time-of-flight, intensity, and phase changes of the reflected waves, SAM generates two-dimensional or three-dimensional images of the sample’s internal structure.
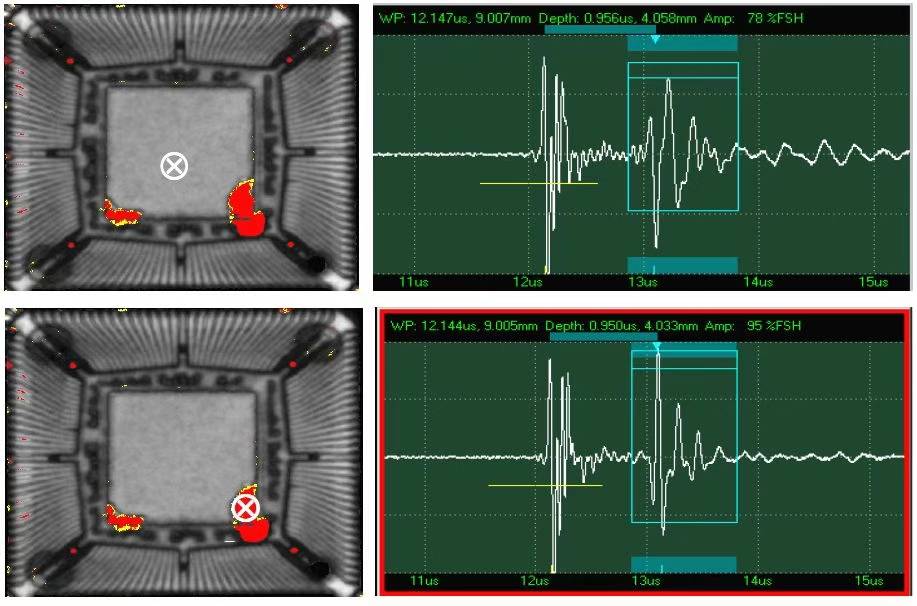
A-Scan is a testing method that displays ultrasonic echo signals in a waveform format, with the horizontal axis representing the time or depth of sound wave propagation and the vertical axis representing the amplitude of the echo signal. When ultrasonic waves encounter defects (such as delaminations or voids) or interfaces inside a material, reflected signals are generated, appearing as peaks at different positions and amplitudes on the A-Scan waveform. By analyzing the position and amplitude of these peaks, the depth and size of defects can be determined.
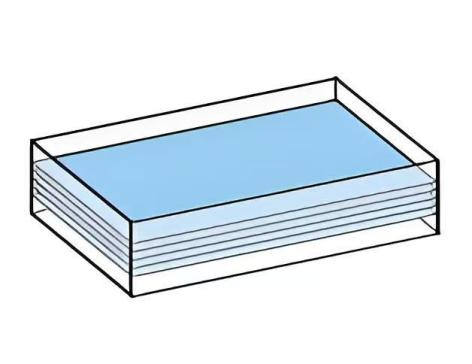
B-Scan involves moving an ultrasonic transducer along a straight line (in the X or Y direction) across the sample surface, continuously acquiring a series of A-Scan signals. These signals are then arranged in spatial sequence to form a two-dimensional cross-sectional image of the internal structure of the sample. The horizontal axis represents the scanning position along the path, while the vertical axis represents the depth of sound wave propagation. This allows for an intuitive visualization of the shape and location of internal interfaces and defects (such as delaminations, cracks, and voids), enabling precise measurement of their depth and dimensions.
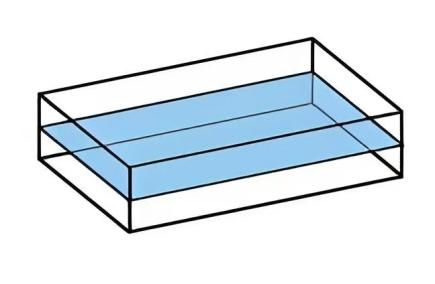
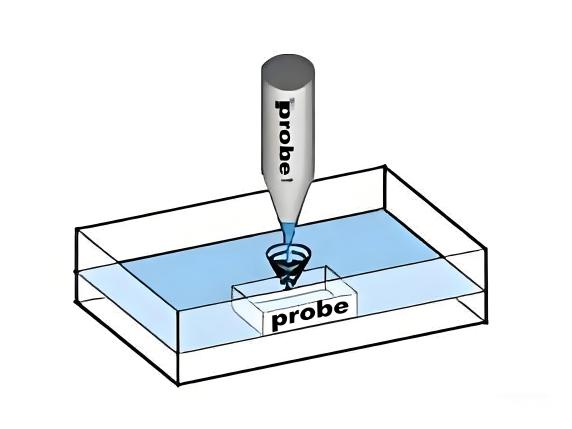
C-Scan performs a two-dimensional raster scan over the sample surface in a meandering (zigzag) pattern, collecting and combining data line by line to generate a planar image parallel to the sample surface (an XY cross-section). Each pixel in the image represents the echo signal intensity within a specific depth range, typically defined by a time gate set using A-Scan data. This allows for intuitive visualization of the in-plane distribution and size of internal defects such as delaminations and voids. Defective areas like delaminations often exhibit high signal intensity due to total reflection of the acoustic wave, and the system can automatically identify these regions and highlight them in a designated color (e.g., red), enabling rapid assessment of defect location and extent.
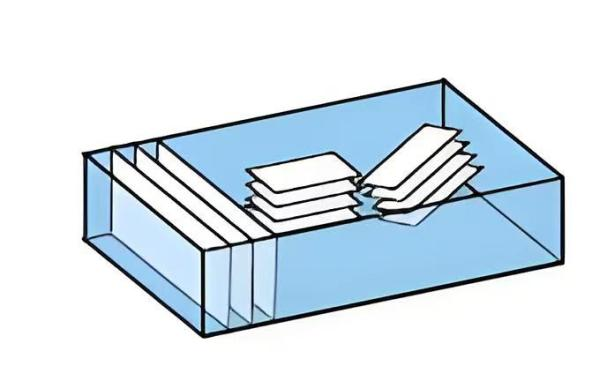
X-Scan is an advanced ultrasonic imaging mode that can generate and simultaneously display multiple C-Scan images from different depth layers in real time during a single scanning process (typically more than 50 layers), with each image representing a horizontal cross-section at a specific depth within the sample. This allows users to observe the distribution of defects or structures—such as delaminations and voids—at various depths simultaneously. Operators can freely select regions of interest and desired depth layers, enabling dynamic and comprehensive 3D analysis of the sample’s internal structure.
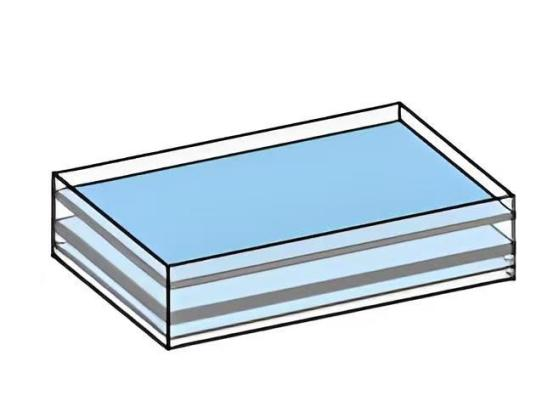
G-Scan is a multi-layer ultrasonic imaging technique that acquires multiple C-Scan images from different depth layers within a sample simultaneously during a single scan by setting multiple time gates. Each time gate corresponds to a specific depth range, and the system automatically collects data and generates planar images for each layer, enabling synchronized inspection of multi-layer structures or defects inside the material. Users can predefine depth and thickness parameters for each layer and save them as inspection programs for automatic execution and evaluation in subsequent tests.
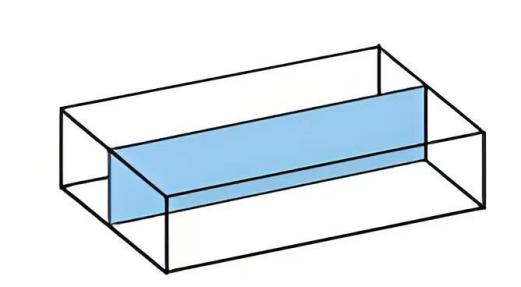
D-Scan is an ultrasonic imaging mode that combines features of B-Scan and C-Scan. It performs a two-dimensional raster scan over the sample surface using a specific meandering pattern to generate a diagonal cross-sectional image of the internal structure. This image represents an oblique section (a combination of XZ or YZ directions), providing an intuitive view of the internal structure and defect distribution—such as delaminations and cracks—along a slanted path through the sample. D-Scan is particularly useful for analyzing complex geometries or detecting flaws that are not aligned with conventional cross-sections. It serves as an effective complement to traditional B-Scan (linear cross-section) and C-Scan (horizontal cross-section), offering a more flexible perspective for inspection.
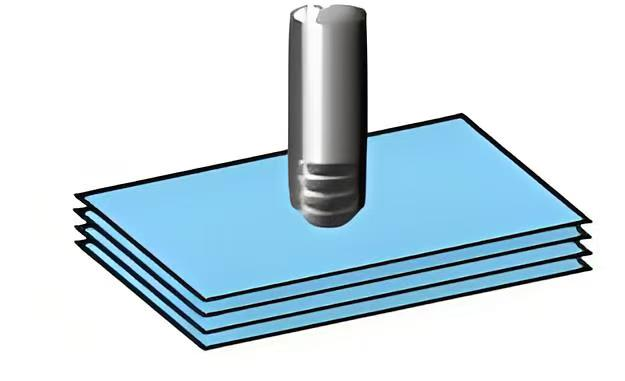
Z-Scan is an advanced ultrasonic imaging technique based on 3D data acquisition. By performing a high-density scan across the entire volume of a sample, it captures full spatial acoustic information, enabling the simulation of three-dimensional imaging of the internal structure of substrates or complex components. After scanning, users can flexibly select any depth range (time gate) offline and reconstruct various imaging modes from the dataset, including A-Scan, B-Scan, C-Scan, D-Scan, P-Scan, X-Scan, and Time-of-Flight (TOF) images. This capability allows inspectors to repeatedly analyze the internal structure of the sample from different perspectives and dimensions, significantly enhancing defect localization, diagnosis, and data traceability. Z-Scan is particularly suitable for comprehensive, high-reliability non-destructive testing of electronic packages, advanced packaging, and multi-layered materials.
Through-Scan is a transmission-based ultrasonic imaging technique that uses two opposing transducers—one positioned above the sample to transmit ultrasonic waves, and another below to receive the signals that pass through the sample. When internal defects such as delaminations or voids are present, the ultrasonic waves are strongly reflected or scattered at the defect sites, reducing the acoustic energy that reaches the bottom of the sample. This results in “acoustic shadows” or areas of signal loss on the receiver side. By analyzing the distribution of these shadows, the location and extent of defects can be intuitively determined. Through-Scan is typically performed simultaneously with reflective C-Scan, providing complementary inspection information.
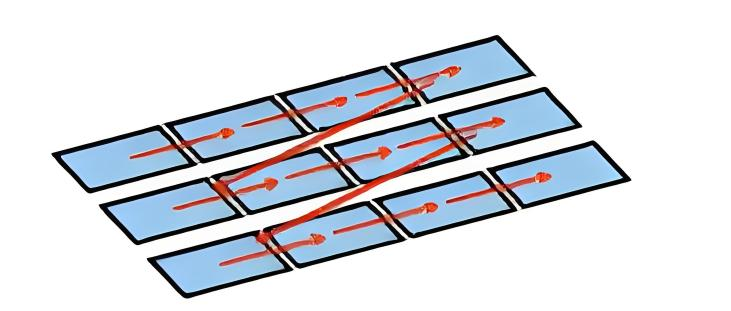
T-Scan (Tray Scan) is an ultrasonic scanning mode designed for automated, high-throughput inspection. It allows multiple identical samples, evenly spaced, to be placed on a dedicated tray or holder. The system then automatically scans and evaluates each sample in sequence according to a pre-defined order and scanning path. This mode requires no manual intervention, enabling efficient and continuous inspection of large batches of samples while ensuring consistency and repeatability in the testing process.
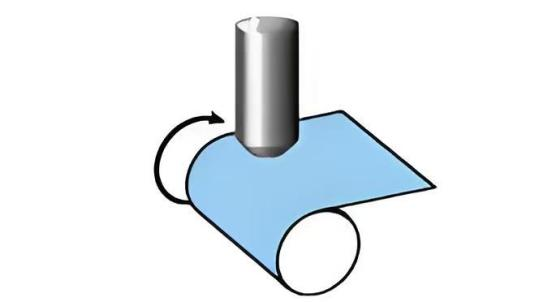
ROT-Scan (Rotation Scan) is a specialized ultrasonic imaging mode designed for inspecting cylindrical samples. During the inspection, the sample rotates uniformly around its central axis while the ultrasonic transducer scans axially or radially. This enables comprehensive coverage of the entire circumferential surface and internal structure of the sample. The method is highly effective in detecting circumferentially distributed defects such as delaminations, cracks, and voids, ensuring the structural integrity of cylindrical components like lead frames, metal pins, and encapsulated rods.
V(z)-Scan is a material characterization technique based on acoustic microscopy. It involves fixing the sample position while moving the focused lens of the ultrasonic transducer along the Z-axis (vertical direction) to measure the intensity of reflected acoustic signals at different positions. These intensity values are then plotted as a function of the Z-axis position, forming a V(z) curve. The curve exhibits a periodic oscillation pattern, the amplitude and period of which are closely related to physical properties of the material surface, such as acoustic impedance and elastic modulus. By analyzing the shape of the V(z) curve, mechanical and acoustic properties of the material can be quantitatively determined.