Advanced SAT Analysis for EMC Delamination: Techniques for Defect Characterization
views:1,602
author:admin
source:Hiwave
time:2025-02-08
catogory:Frequently Asked Questions
When inspecting the quality of encapsulated products, beginners often only look at C-SCAN images, focusing on colored areas where red and yellow indicate delaminatio……
When inspecting the quality of encapsulated products, beginners often only look at C-SCAN images, focusing on colored areas where red and yellow indicate delamination, and blue indicates good bonding. However, for senior engineers, they always request SAT waveform data from testing companies to assist in analysis and prevent misjudgment.
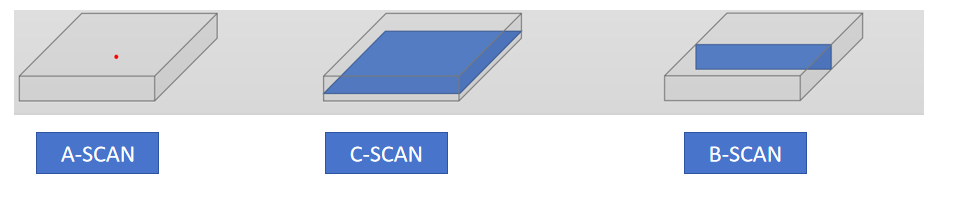
To understand this better, it’s essential to introduce several common SAT scanning methods: A-SCAN, B-SCAN, C-SCAN, T-SCAN, and TAMI-SCAN. Among these, A-SCAN, B-SCAN, C-SCAN, and TAMI-SCAN use reflection mode, while T-SCAN uses transmission mode.
A-SCAN: Displays unprocessed signal waveforms, which can help precisely determine the reflection status at a specific location.
B-SCAN: Shows sectional images.
C-SCAN: Focuses energy on the plane to be inspected, scanning and then displaying the processed reflection images of the entire plane.
TAMI-SCAN: Performs layer-by-layer scanning and displays results, essentially conducting a C-SCAN over various depths with a certain step size.
T-SCAN: Uses transmission mode, determining whether there is delamination throughout the product by analyzing the transmitted signal strength, but it cannot identify the exact layer where delamination occurs.
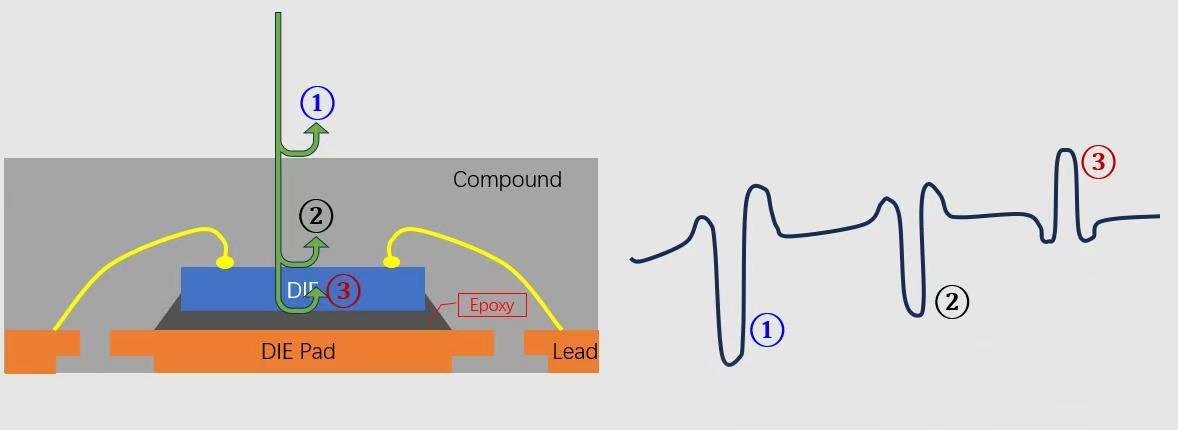
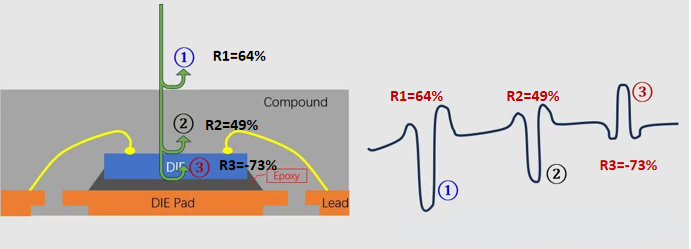
A-SCAN Waveform Analysis for Encapsulated Product Delamination
“①” represents the reflection signal from the upper surface of our encapsulant,
“②” represents the reflection signal from the upper surface of the chip,
“③” represents the reflection signal from the lower surface of the encapsulant.
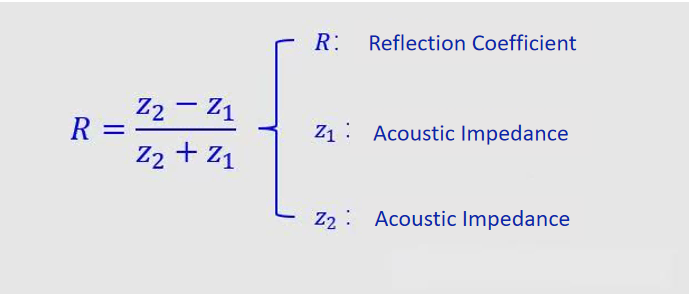
The magnitude and direction of the reflection signals are described by a new term called the “acoustic impedance,” denoted as “Z.” The formula for acoustic impedance is as follows:
The magnitude of the reflection coefficient determines the signal peak, while the sign (positive or negative) of the reflection coefficient determines the waveform direction. The size of the reflection signal is related to the medium’s density. Therefore, further research was conducted, revealing that the acoustic impedance is influenced by both the medium’s density and sound velocity. The calculation formula for acoustic impedance is:
Z=ρ⋅c
ρ is the density of the material,
c is the speed of sound in the material.
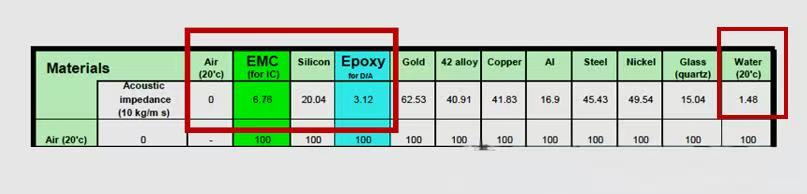
Here are the acoustic impedances of several common encapsulation materials:
Since SAT is typically performed in a liquid medium, and the acoustic impedance of water is 1.48, the acoustic impedances of EMC, silicon, and epoxy are 6.76, 20.04, and 3.12, respectively. Based on these values, the reflection coefficients are calculated as follows:
R1=64%
R2=49%
R3=−73%
Therefore, the waveform of signal 3 is in the opposite direction compared to signals 1 and 2.
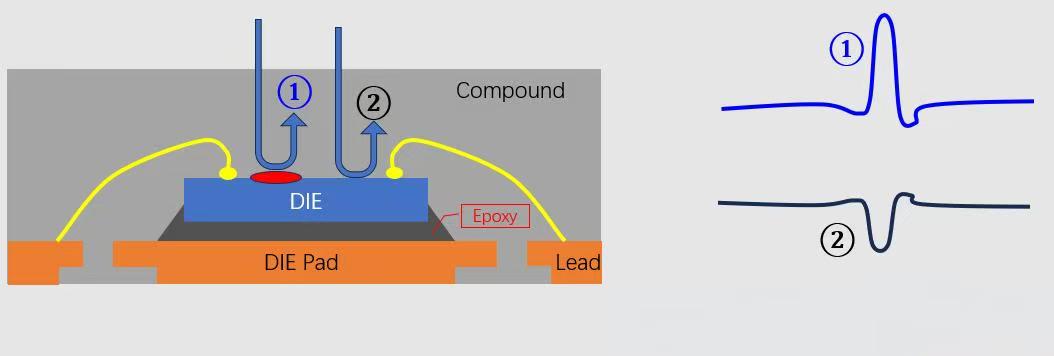
Upper Surface Delamination
When delamination occurs at the upper surface of the chip, the reflection coefficient equals -100%, meaning all energy is reflected back, resulting in total reflection. Therefore, both the direction and amplitude of the waveform are different from those at normal (non-delaminated) positions.
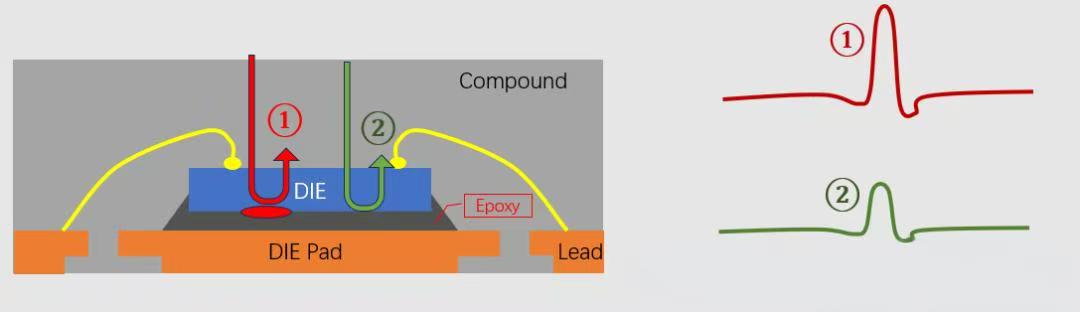
Bottom Surface Delamination
When delamination occurs at the bottom surface of the chip, the reflection coefficients are negative. Therefore, the waveform direction remains the same as in normal (non-delaminated) areas, with only the amplitude differing.