Analysis of Void Fraction in Scanning Acoustic Microscope
views:1,186
author:Hiwave
source:Hiwave
time:2025-04-02
catogory:Frequently Asked Questions
With the continuous development of electronic packaging technology, the internal structure and quality control of packaging have become increasingly important. As a ……
With the continuous development of electronic packaging technology, the internal structure and quality control of packaging have become increasingly important. As a non-destructive testing tool, the Scanning Acoustic Microscope (SAM) has demonstrated unique advantages in detecting semiconductor devices, circuit boards, and other electronic components. This article explores the principle behind how this equipment calculates the void fraction.
In electronic packaging, voids refer to bubble-like gaps present in solder joints or substrates. Although these gaps are small, they can significantly affect the performance and stability of electronic components.
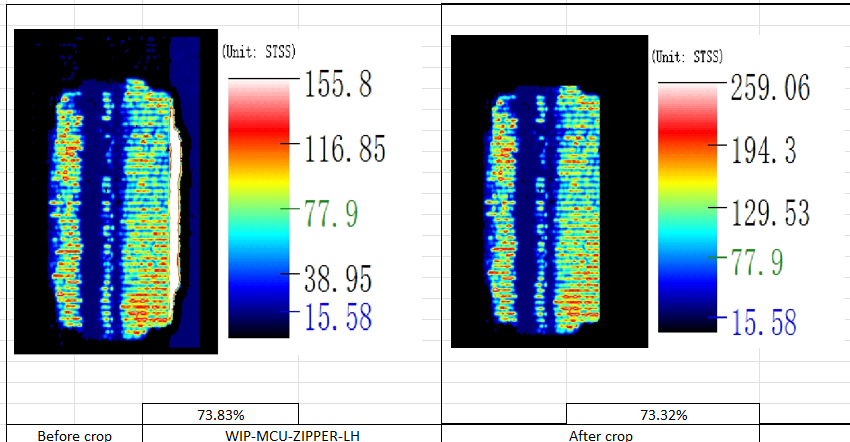
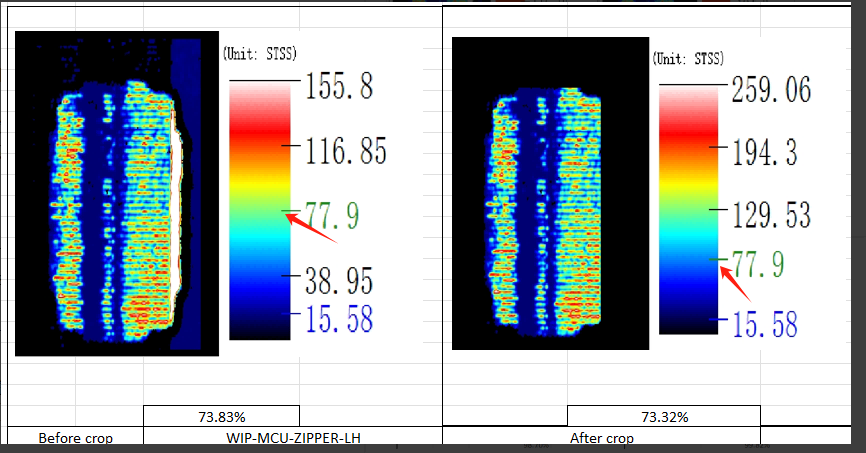
Take the following set of images as an example. Below each image, there is a percentage value, which represents the void fraction or bonding rate of the workpiece (depending on the specific situation). Why does the percentage value decrease after a portion of the image on the right is cropped?
Here, we need to understand the principle behind how the Scanning Acoustic Microscope calculates the void fraction and bonding rate:
All pixels except those in the black areas are used as the denominator. Using a color card threshold (e.g., 116.5 in Problem 2, Image 2), pixels with colors above this threshold are considered defects and are used as the numerator for calculating the void fraction. Pixels with colors below this threshold are considered good and are used as the numerator for calculating the bonding rate.
Now, let’s return to the question: Why does the percentage value decrease after a portion of the image on the right is cropped?
Upon closer inspection, both images use 77.9 as the threshold for calculating the bonding rate. However, the color corresponding to the color card value of 77.9 is inconsistent between the two images. In the first image, green and yellow serve as the boundary; colors greater than green and yellow are considered defects, while those below are considered good, resulting in a higher bonding rate. In the second image, blue serves as the boundary; colors greater than blue—including green and yellow—are considered defects, leading to a lower bonding rate.Analysis of void fraction in Scanning Acoustic Microscope
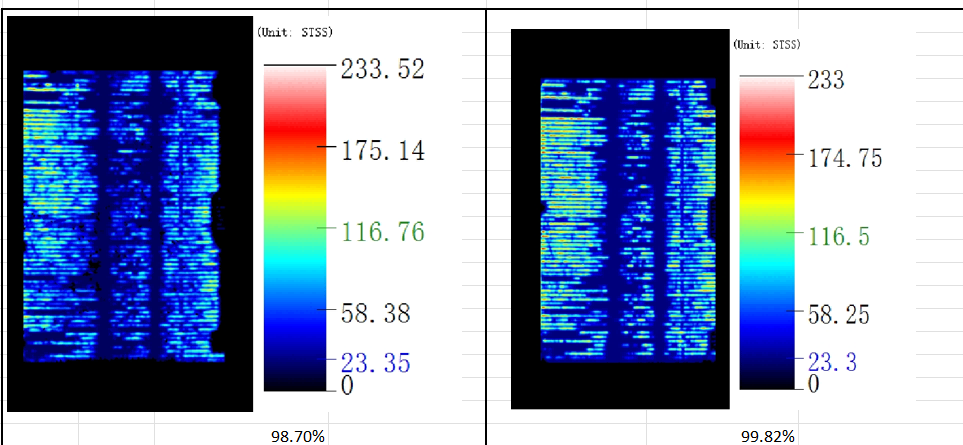
Now let’s look at another example: Why are the bonding rates of these two images different?
The first image (on the left) has fewer green and yellow areas compared to the second image (on the right), but the percentage (% adherence) of the right image is higher, even though it has a larger area of green and yellow. What is the reason for this?
The difference arises because the values corresponding to the color card are not the same. The second image has a threshold of 116.5, which is lower than the 116.76 of the first image. This means that more areas in the second image are counted as defects in the calculation.